Project Overview
As more organizations move toward the cloud, we can utilize Azure Sentinel to help us detect and present this data to enable organizations to effectively respond and remediate incidents in time.
This lab takes inspiration from Charles Q’s Azure Cloud Detection Lab from Cyberwox Academy and Josh Madakor’s Sentinel Map Project. All credits to Charles and Josh I appreciate their hard work advancing the profession.
Note: There are some differences in steps since I plan to add extra functionality to the project later on (Allow * on ASG, Honeypot VM).
In this lab, we will:
- Setup Lab Infrastructure: Set up a Honeypot Virtual Machine, Log Analytics Workspace, and Microsoft Sentinel.
- Create Log Analytics Workspace and Deploy Sentinel**: Connect the VM to Sentinel for analysis.
- Exposing Firewalls Turn off Honeypot VM firewalls and allow all on Network Security Groups.
- KQL Queries: Query logs using Kusto Query Language.
- Generating a Scheduled Task: Create a Scheduled task to build data.
- Write Custom Analytic Rules: Detect specific Microsoft Security Events.
Part 1: Setup Lab Infrastructure
Step 1: Create a Free Azure Account
Create a free Azure account using this link. This process will automatically set up the account and associated Azure Subscription.
Step 2: Deploy a Virtual Machine
Deploy a Windows Virtual Machine to collect data, acting as a Honeypot.
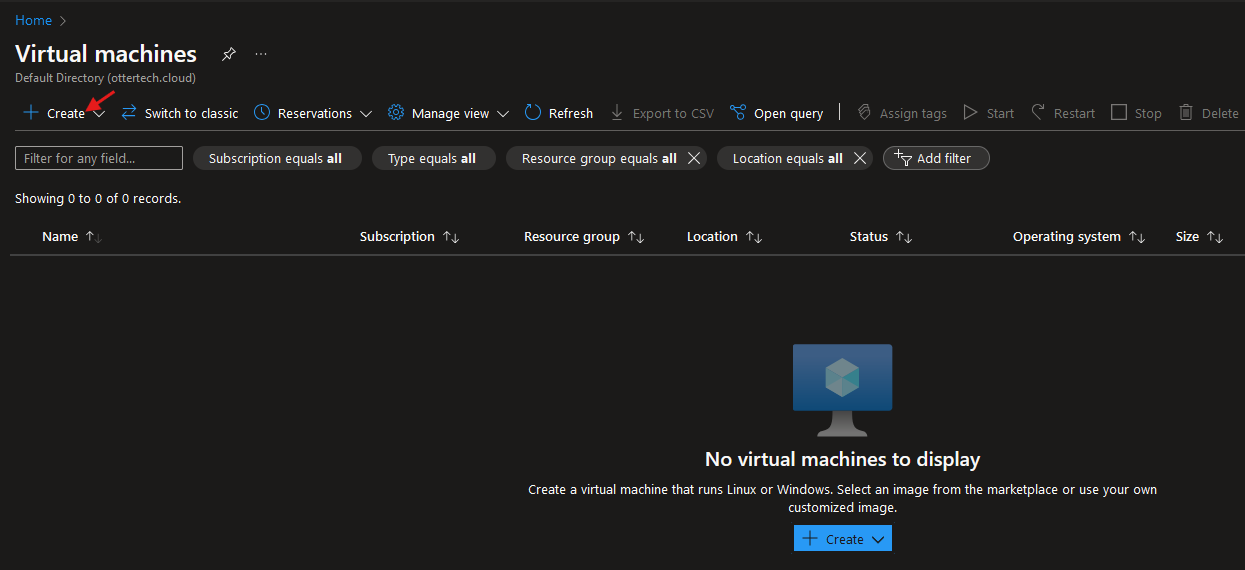
- Navigate to Azure Virtual machines and click “Create”.
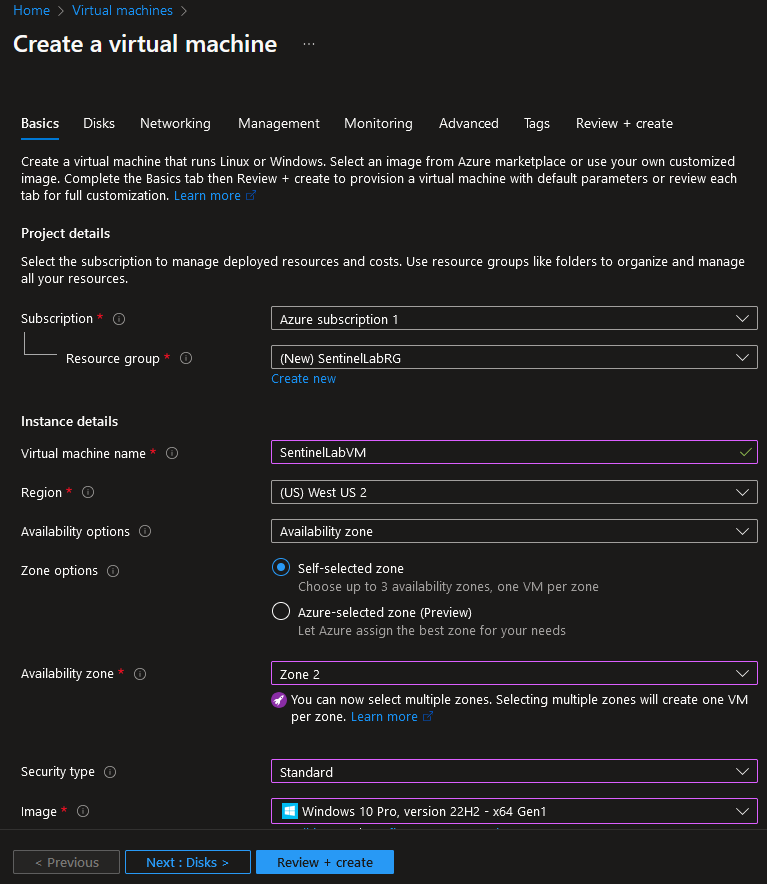
- Create a resource group and give the VM a name. Remember to choose a small VM size that will have ample processing and memory power:
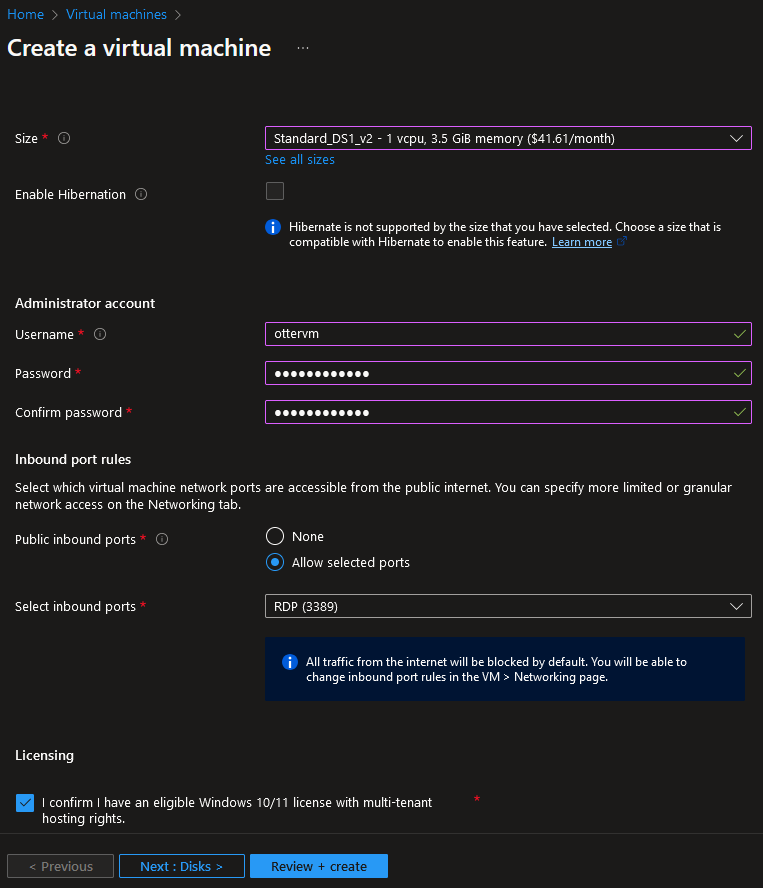
 3. Fill out the username and password of the virtual machine, this will be our login credentials when RDP to the machine. Click “Review + create” and then “Create”:
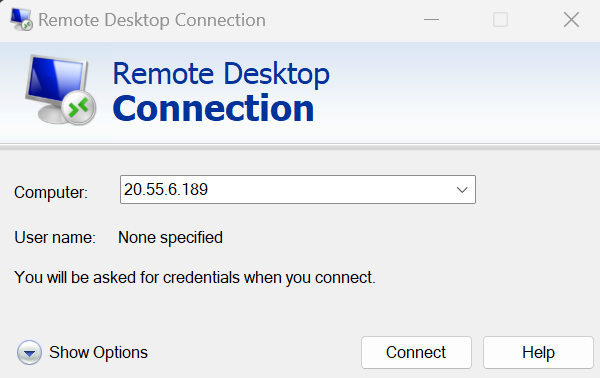
 4. We can now RDP into our virtual machine by typing in our IP address.
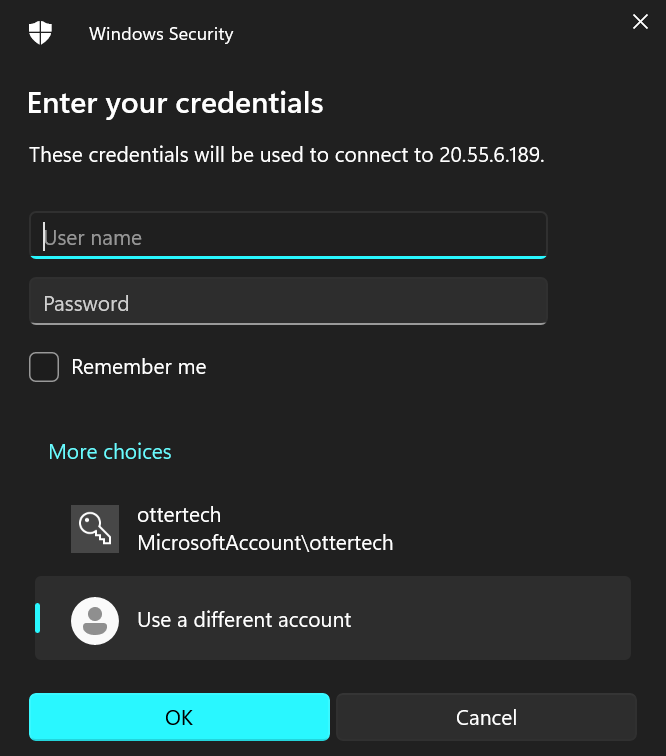
- Choose the use a different account option and enter the credentials you created in Step 3:
Part 2: Create Log Analytics Workspace and Deploy Sentinel
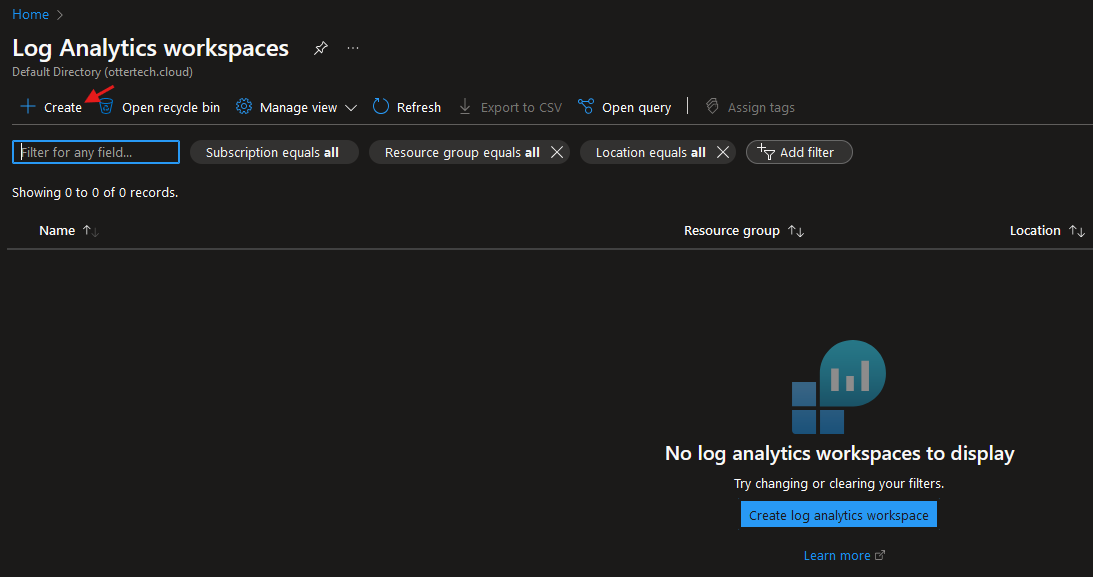
- Search for “Microsoft Sentinel” in the Azure Portal search bar:
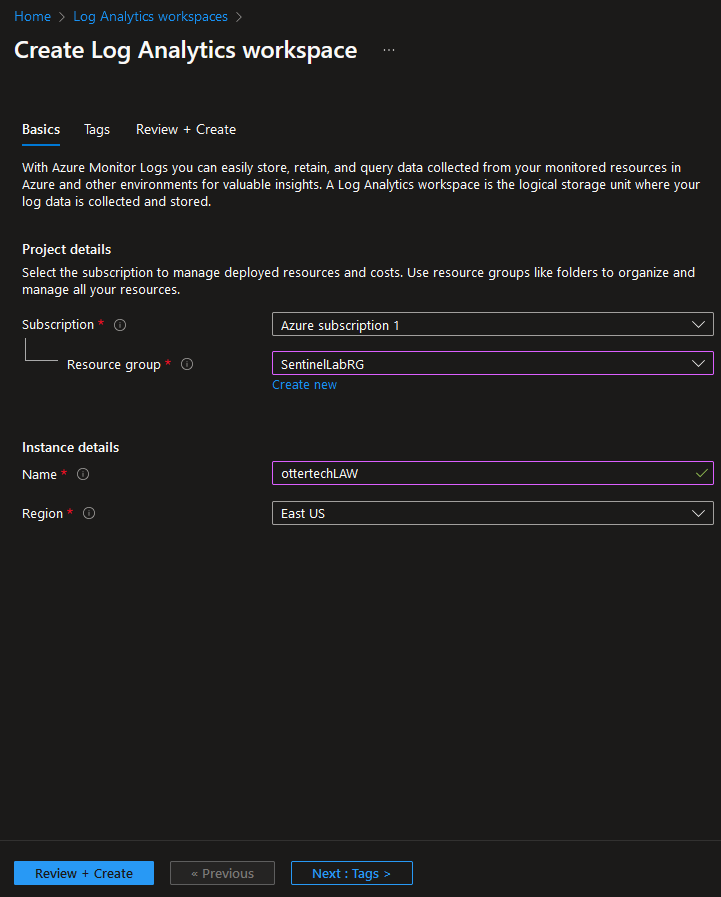
- Follow the prompts to create a Log Analytics Workspace using the same resource group as the VM. Click “Review and Create” to finalize the workspace:
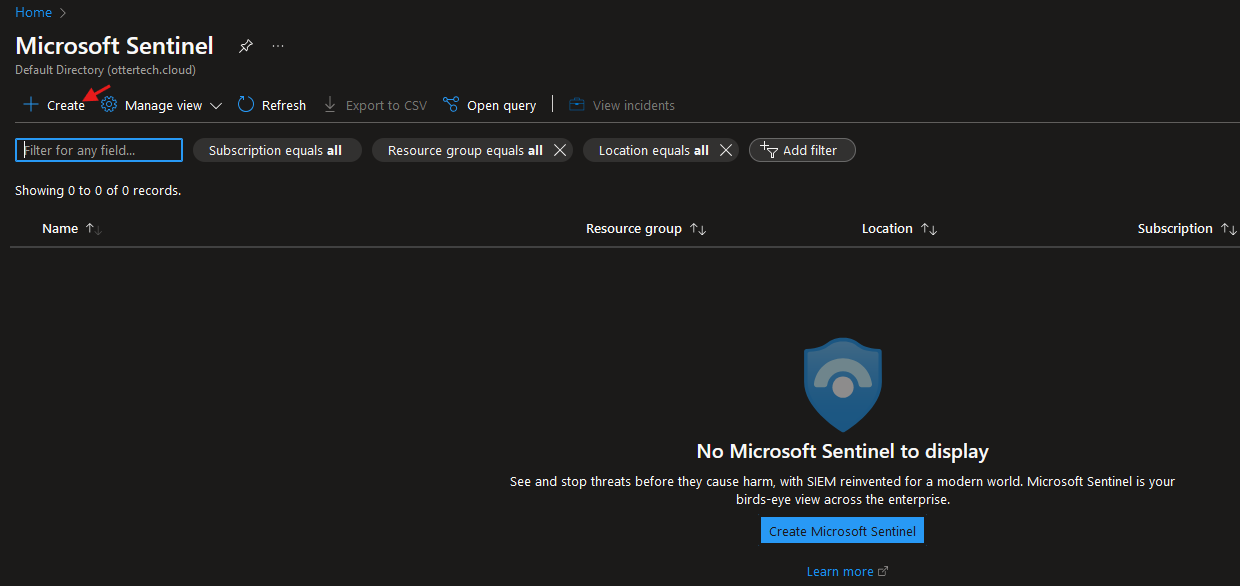
- Search for Sentinel and select ‘Create’:
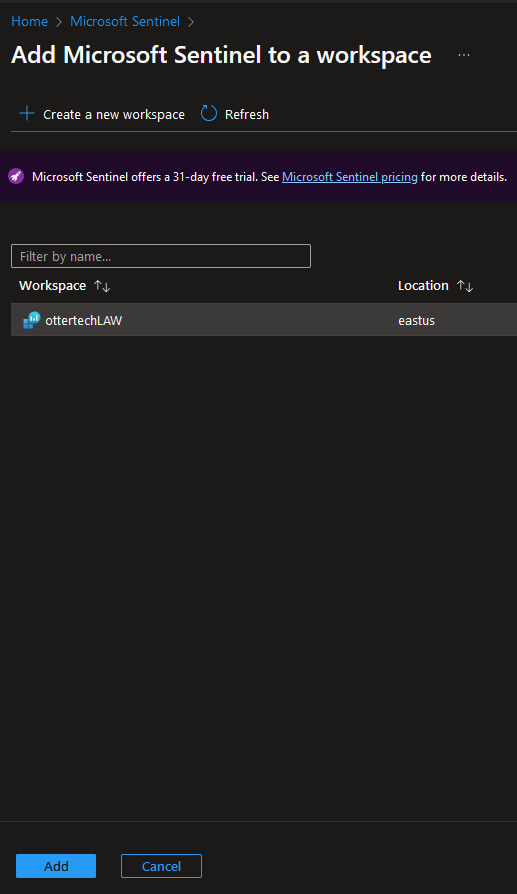
- Select the workspace and ‘Add’:
Part 3: Getting Data into Sentinel
Now that we have the VM running and Sentinel setup, we can import data from the VM to Sentinel. To bring data into Sentinel:
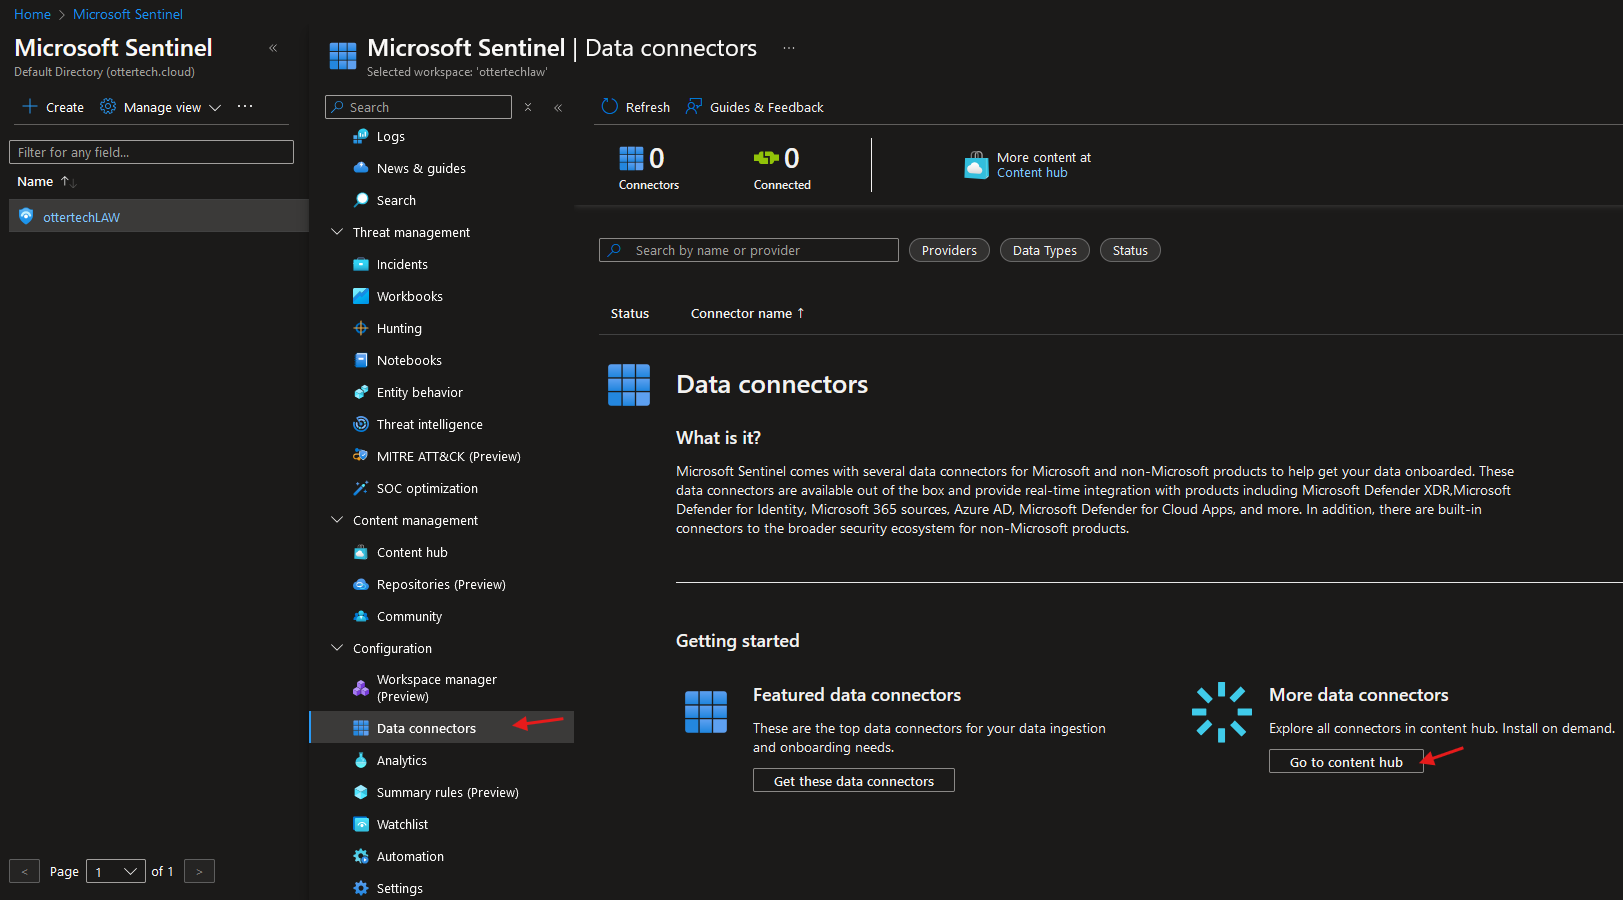
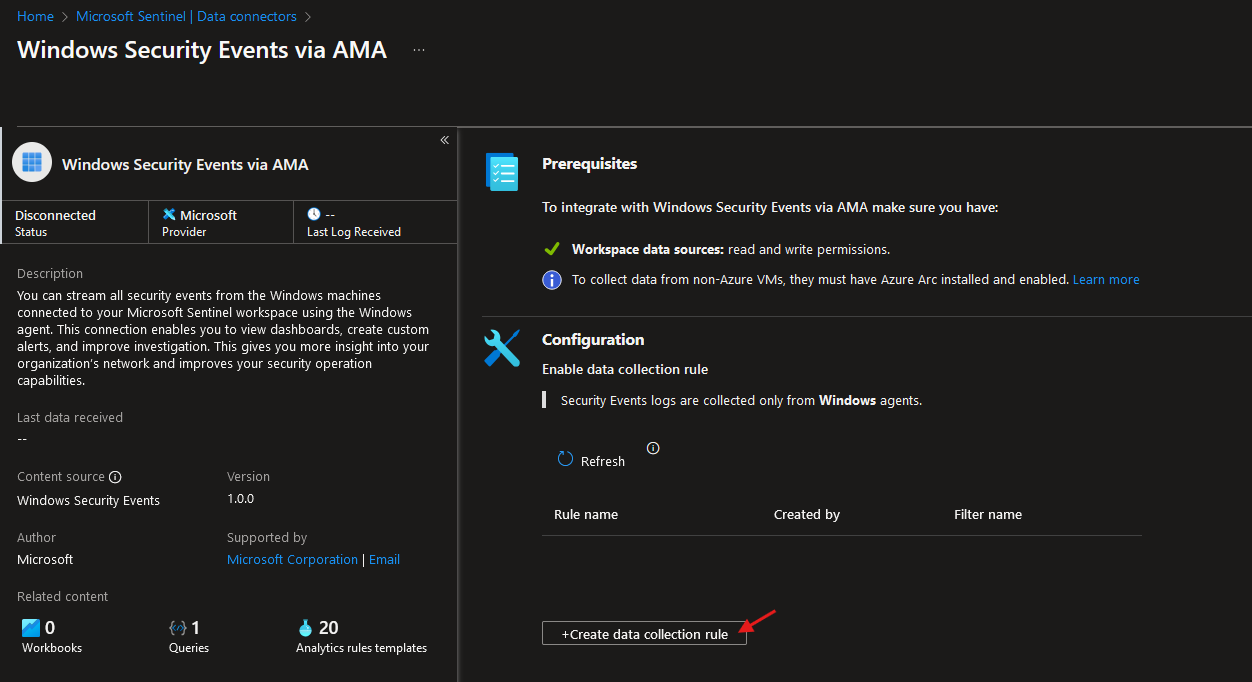
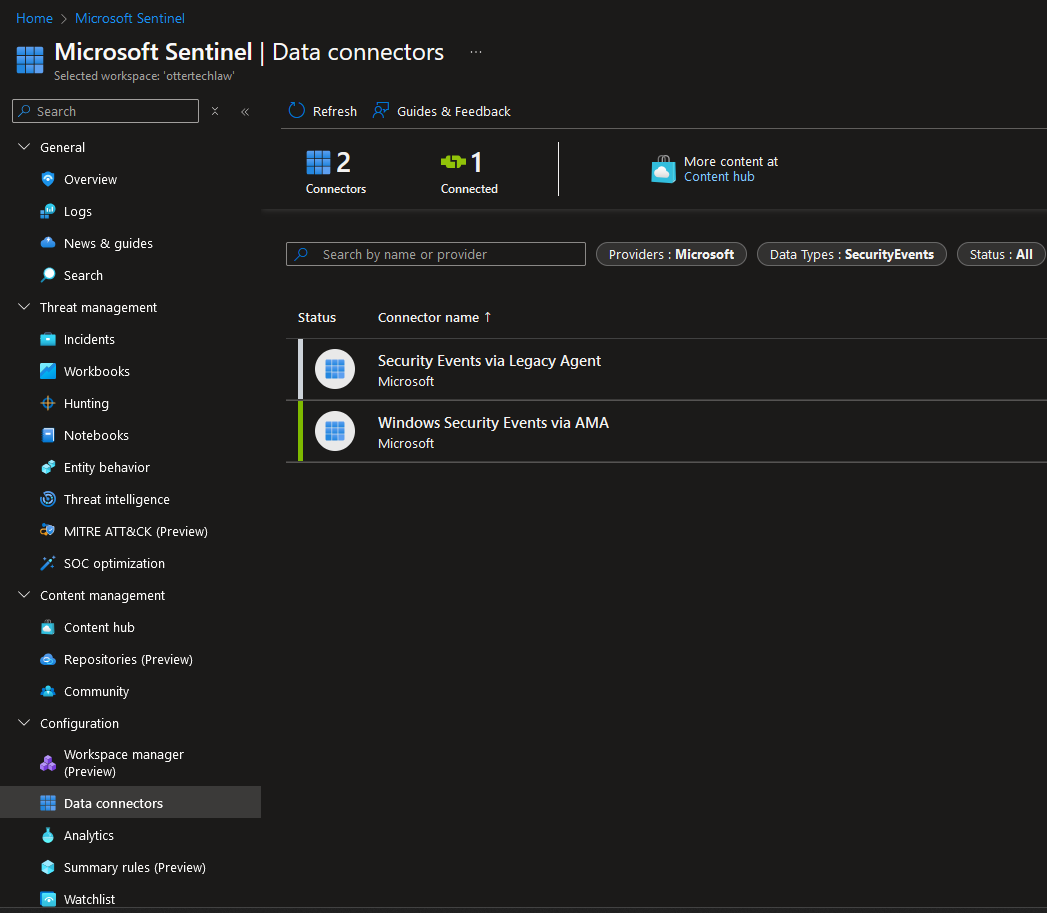
- Navigate to the Data Connectors tab in Sentinel and select ‘Go to content hub’:
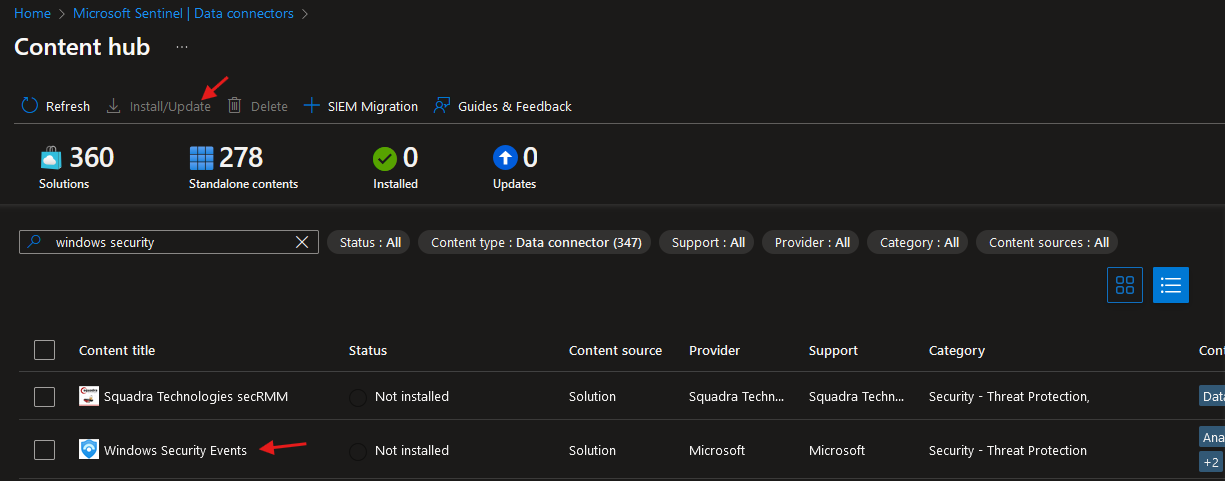
- Search for “Windows Security” and select ‘Install/Update’:
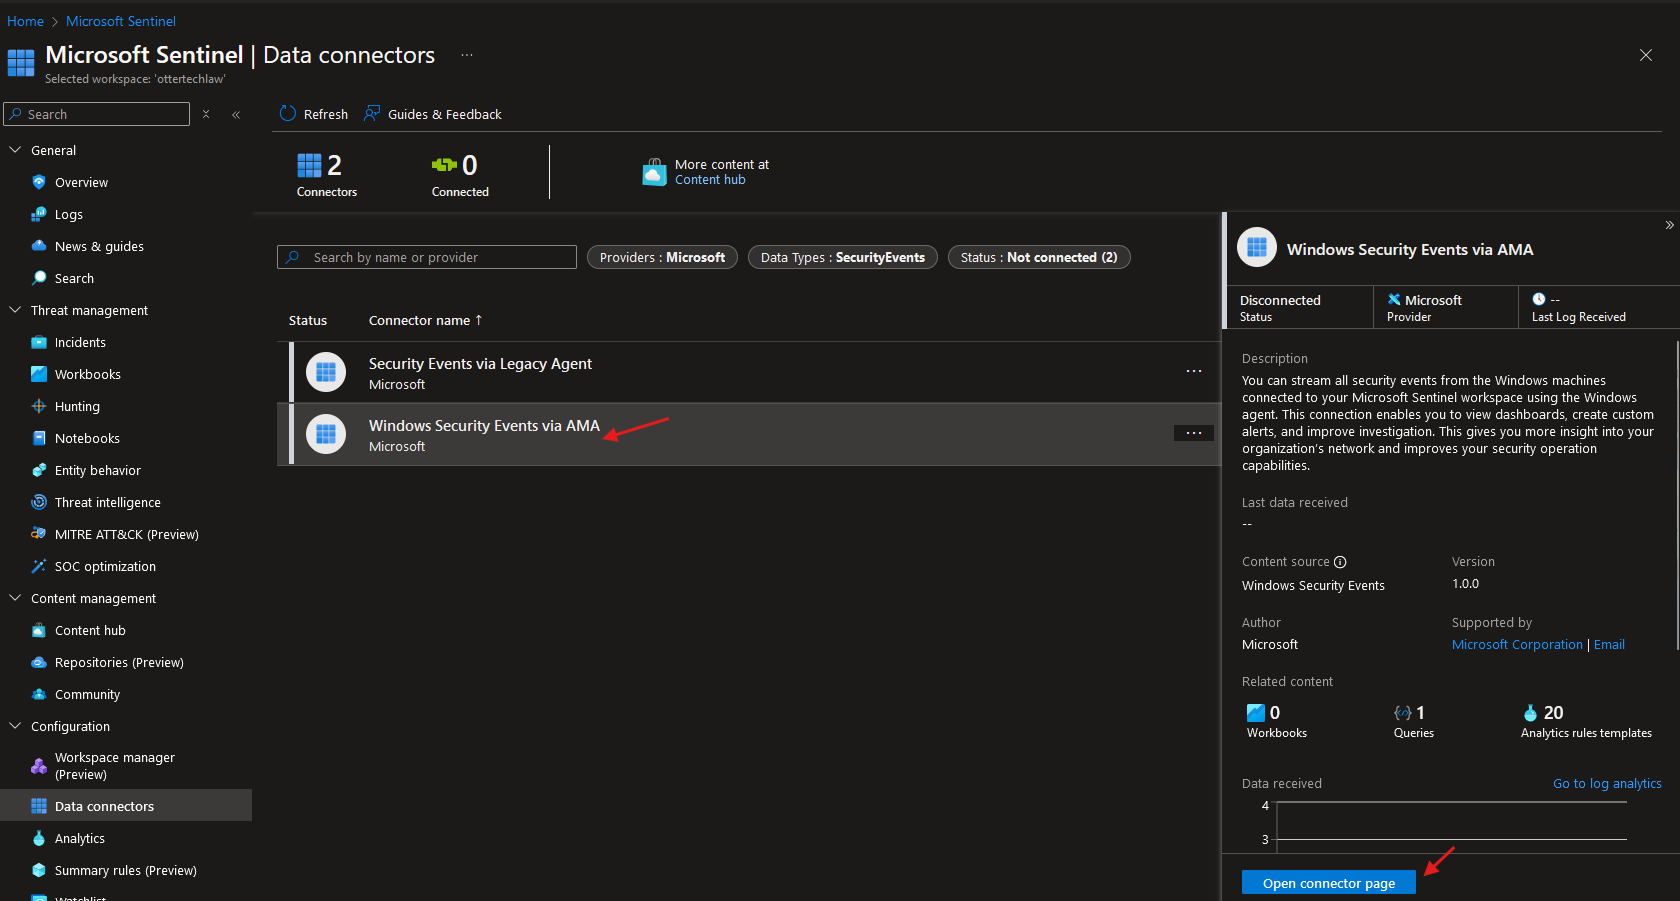
 3. After installation, go back to the data connectors tab and click on ‘Open connector page’:
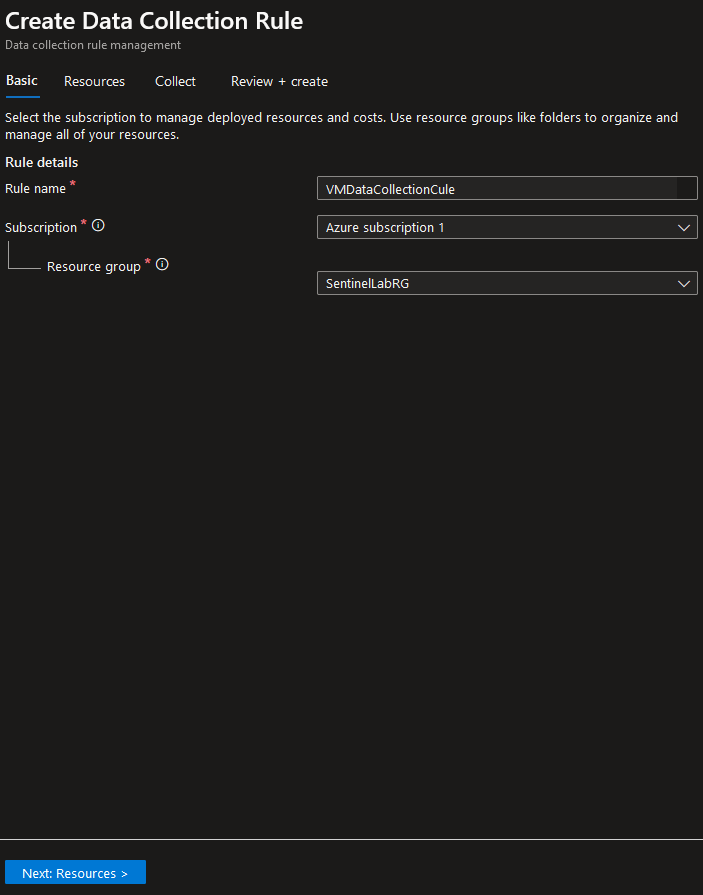
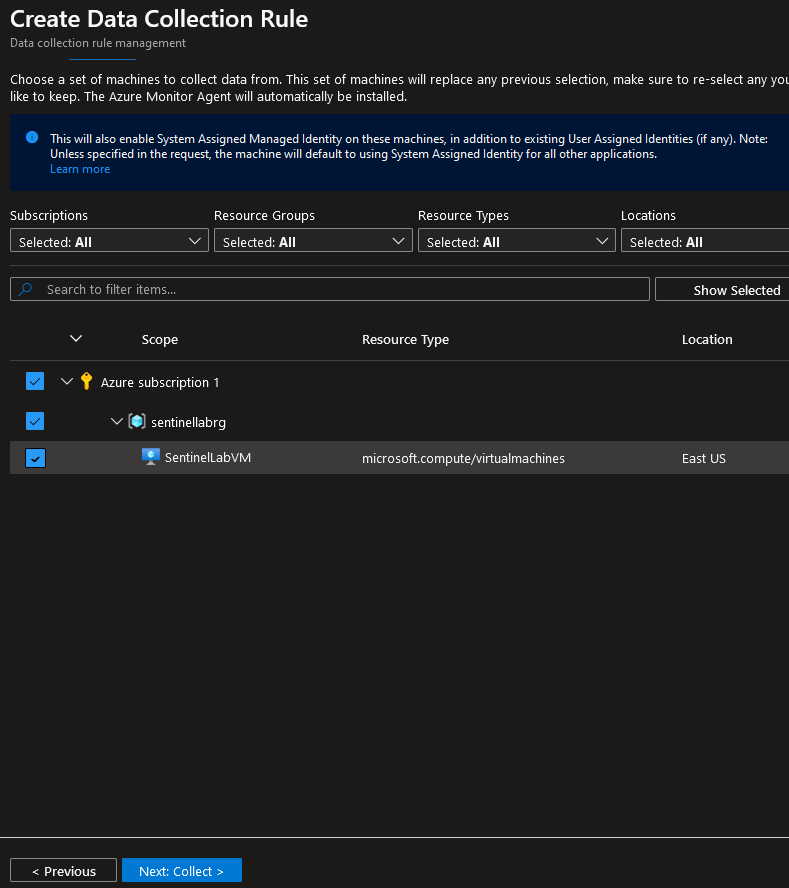
- Add a data collection rule, connect it to the resource group, and add the VM as a resource:
- Fill in the Subscription and Resource Group we created earlier:
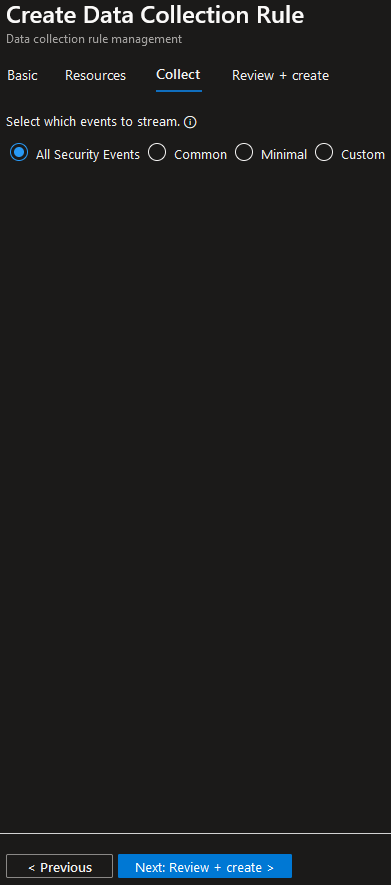
- Choose ‘All security Events’:
- If we go back to the data connectors page, we will see that it is now connected:
Part 4: Exposing NSG and Host Firewall to Generate Security Events
We will expose the Honeypot VM to the public internet generate security events:
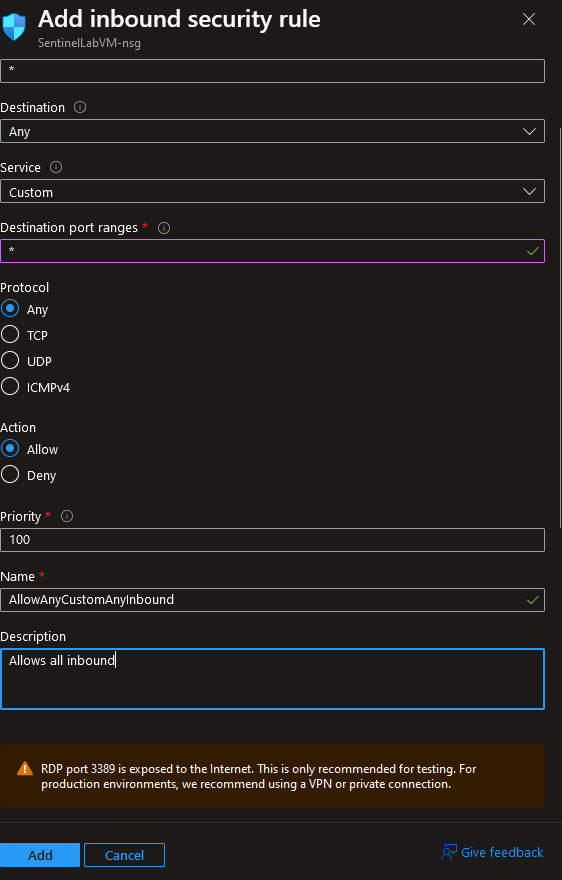
- Create a rule to allow all access to the NSG.
- Remote back into the VM.
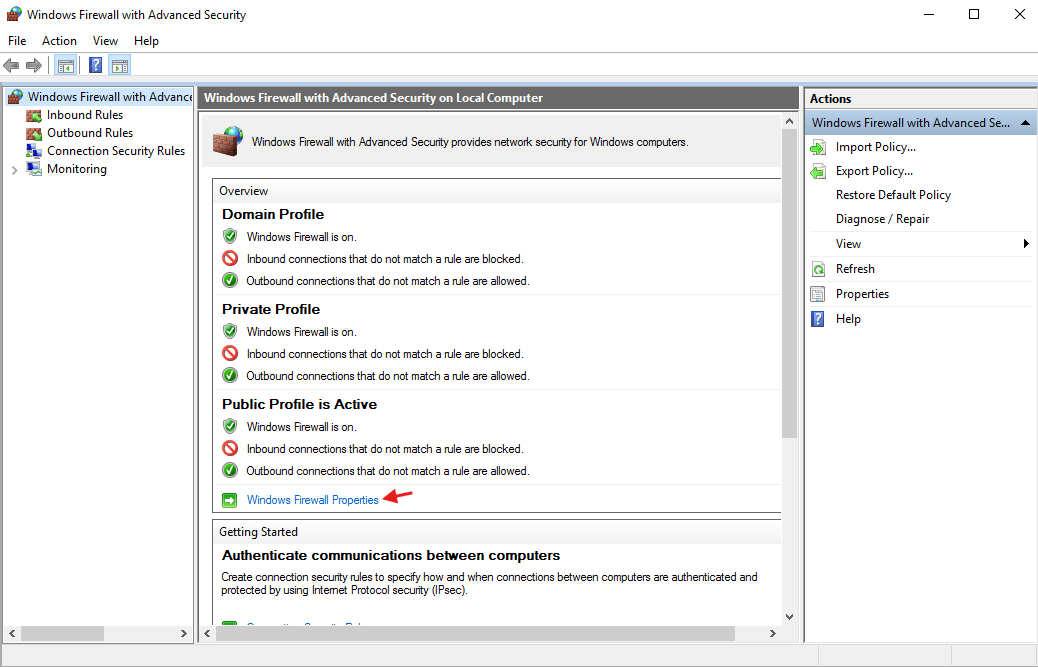
- Search for ‘Windows Firewall’ navigate to ‘Windows Firewall Properties’:
- Turn off all the firewalls for the VM by clicking the drop down and selecting ‘Off’, repeat this for the public and private profiles. Select apply when done:
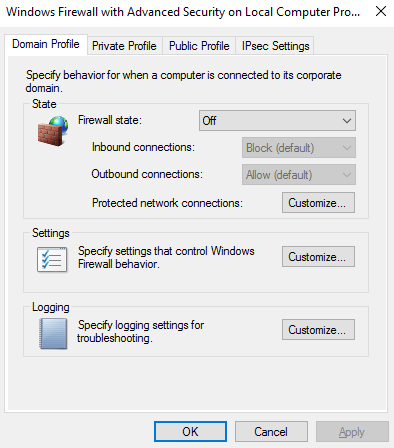
All protection has been removed and we will now receive traffic from external sources.
Part 5: Creating a Scheduled Task to Generate Security Events
In order to setup alerts in Sentinel for events in an endpoint device.
Enable logging for the Event
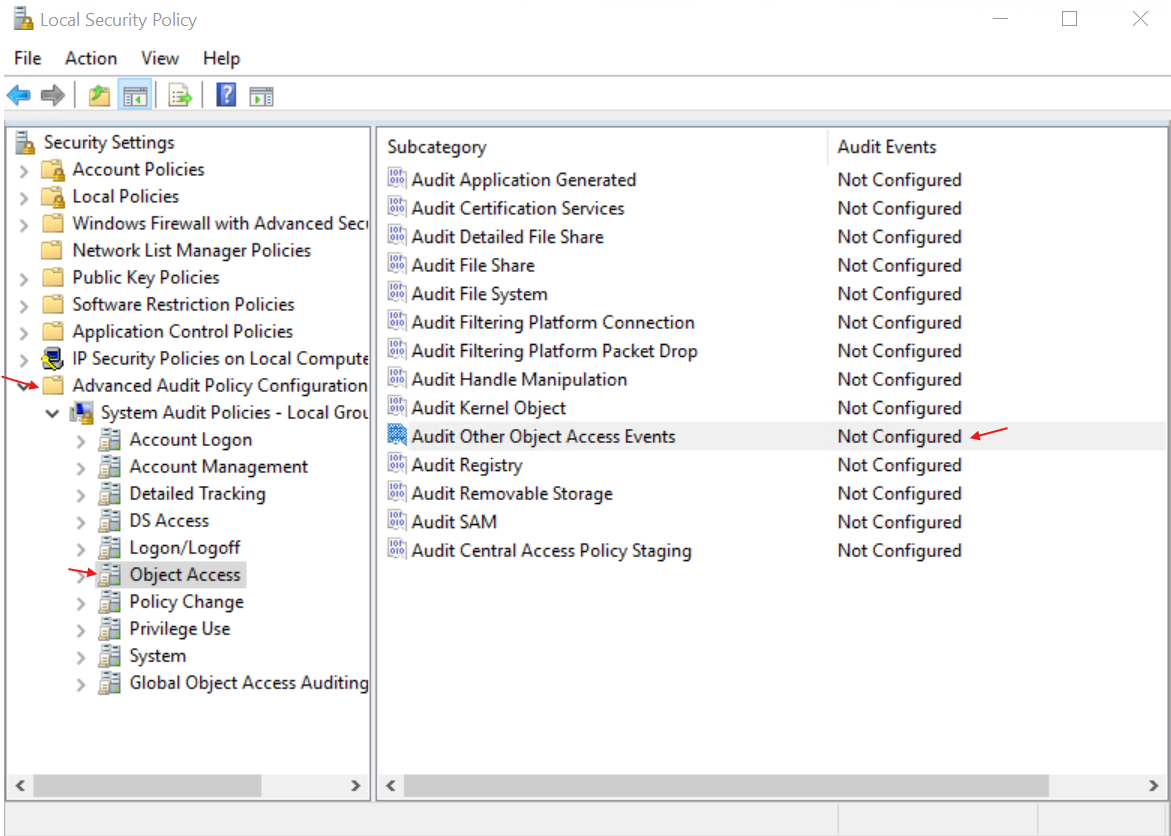
- Remote into the honeypot and search for ‘Local Security Policy’, Select ‘Advanced Audit Policy Configuration’, ‘Object Access’, right click on ‘Audit Other Object Access Events’ and select ‘Properties’:
- Select all the checkboxes on the properties page:
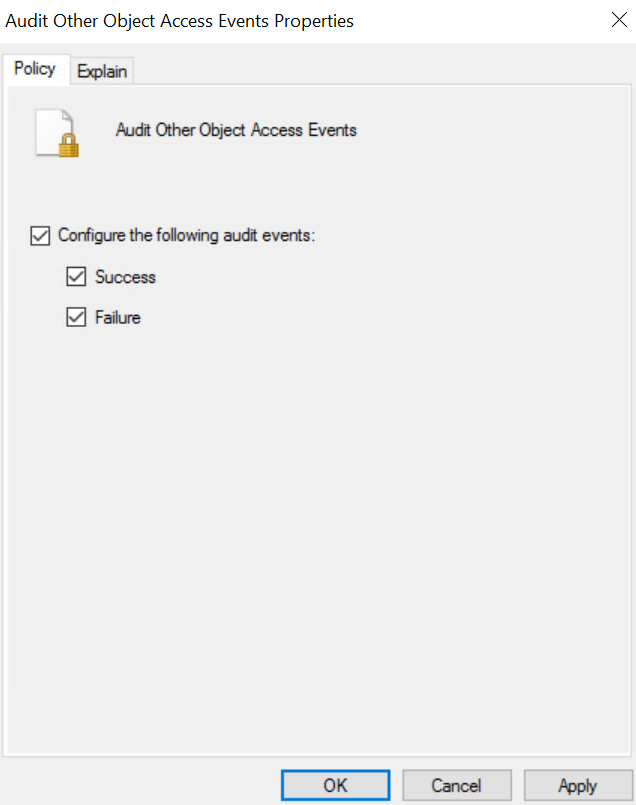 3. Select ‘Apply’ and ‘Ok’.
Creating a Scheduled Task:
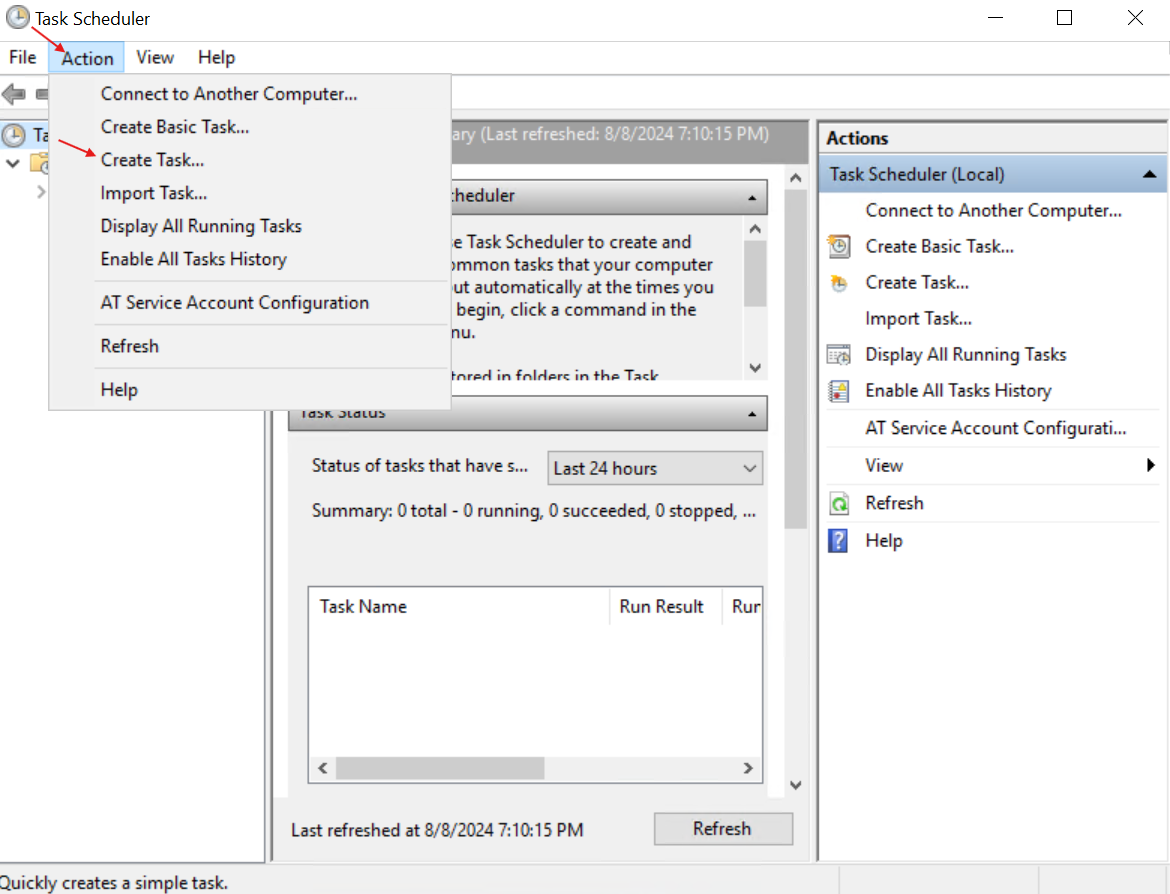
- Search ‘Task Scheduler’ in the Honeypot VM.
- Select ‘Action’ and ‘Create Task’:
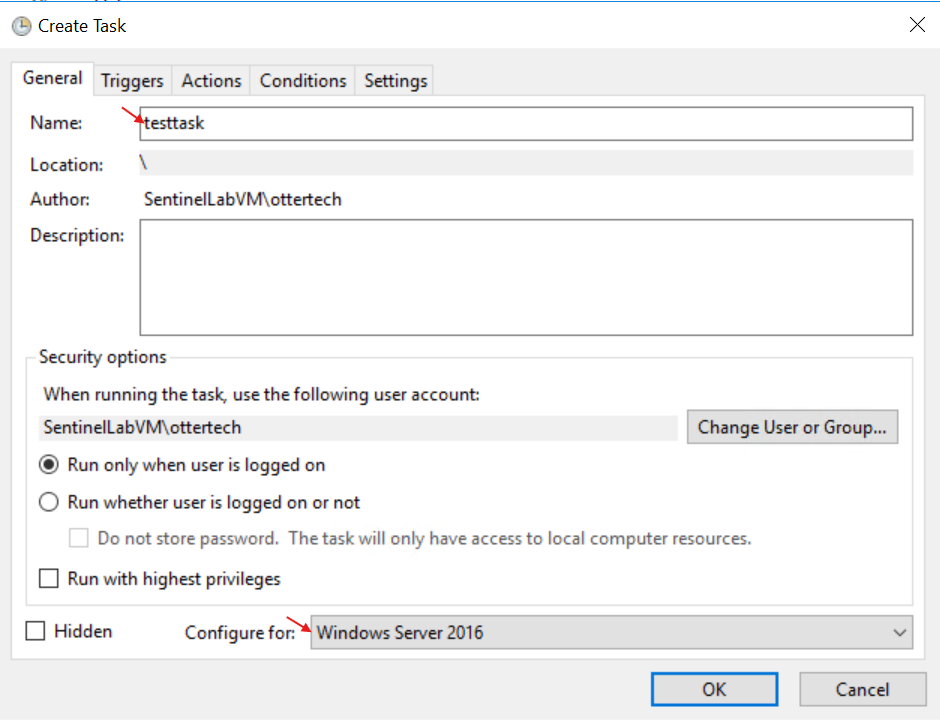
- Give the Task a name and under the ‘Configure for’ section, select your OS:
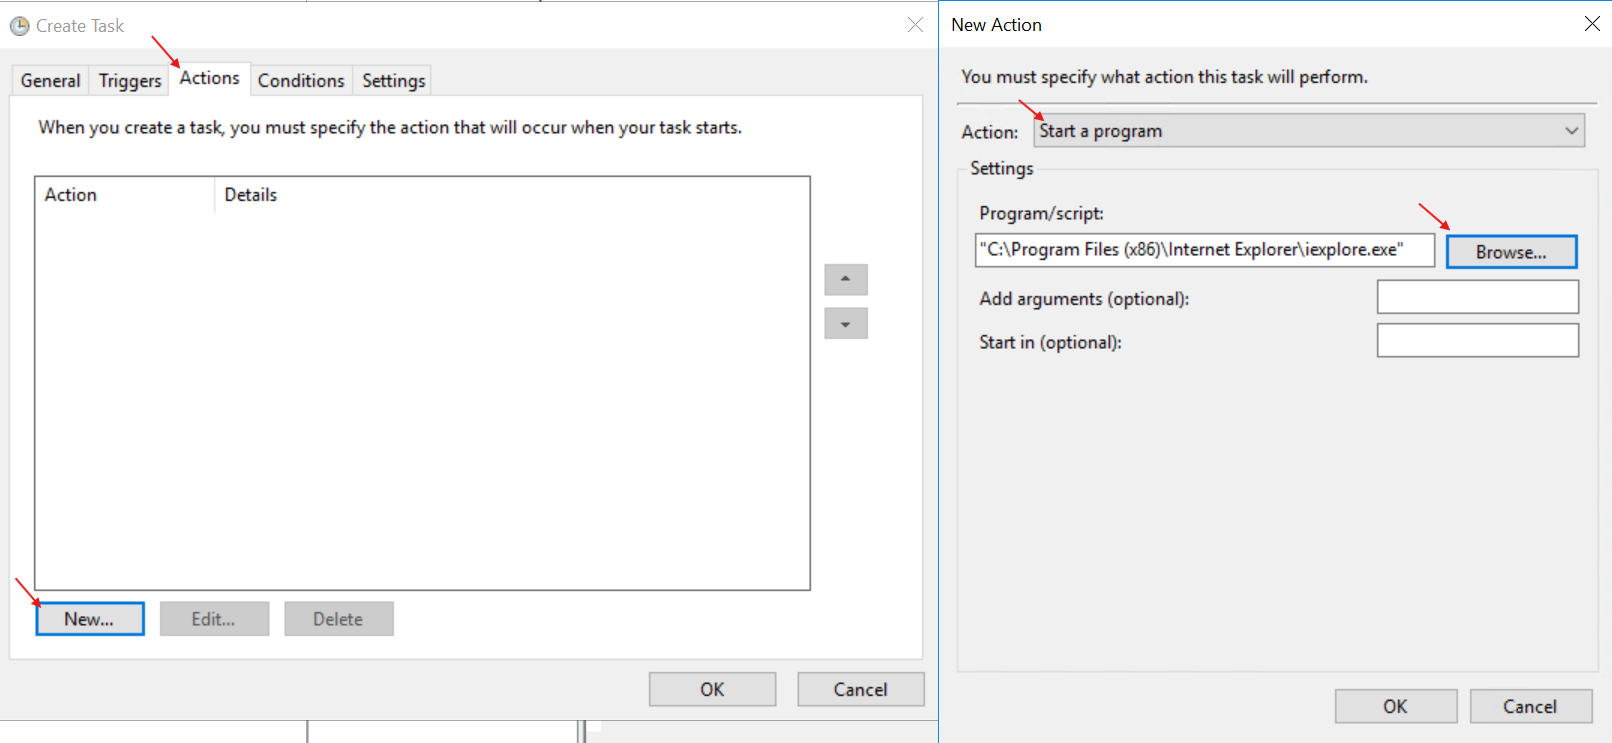
- On the ‘Triggers’ tab, select the ‘New…’ button to create a new trigger. On the right, edit the date to be a couple minutes ahead:
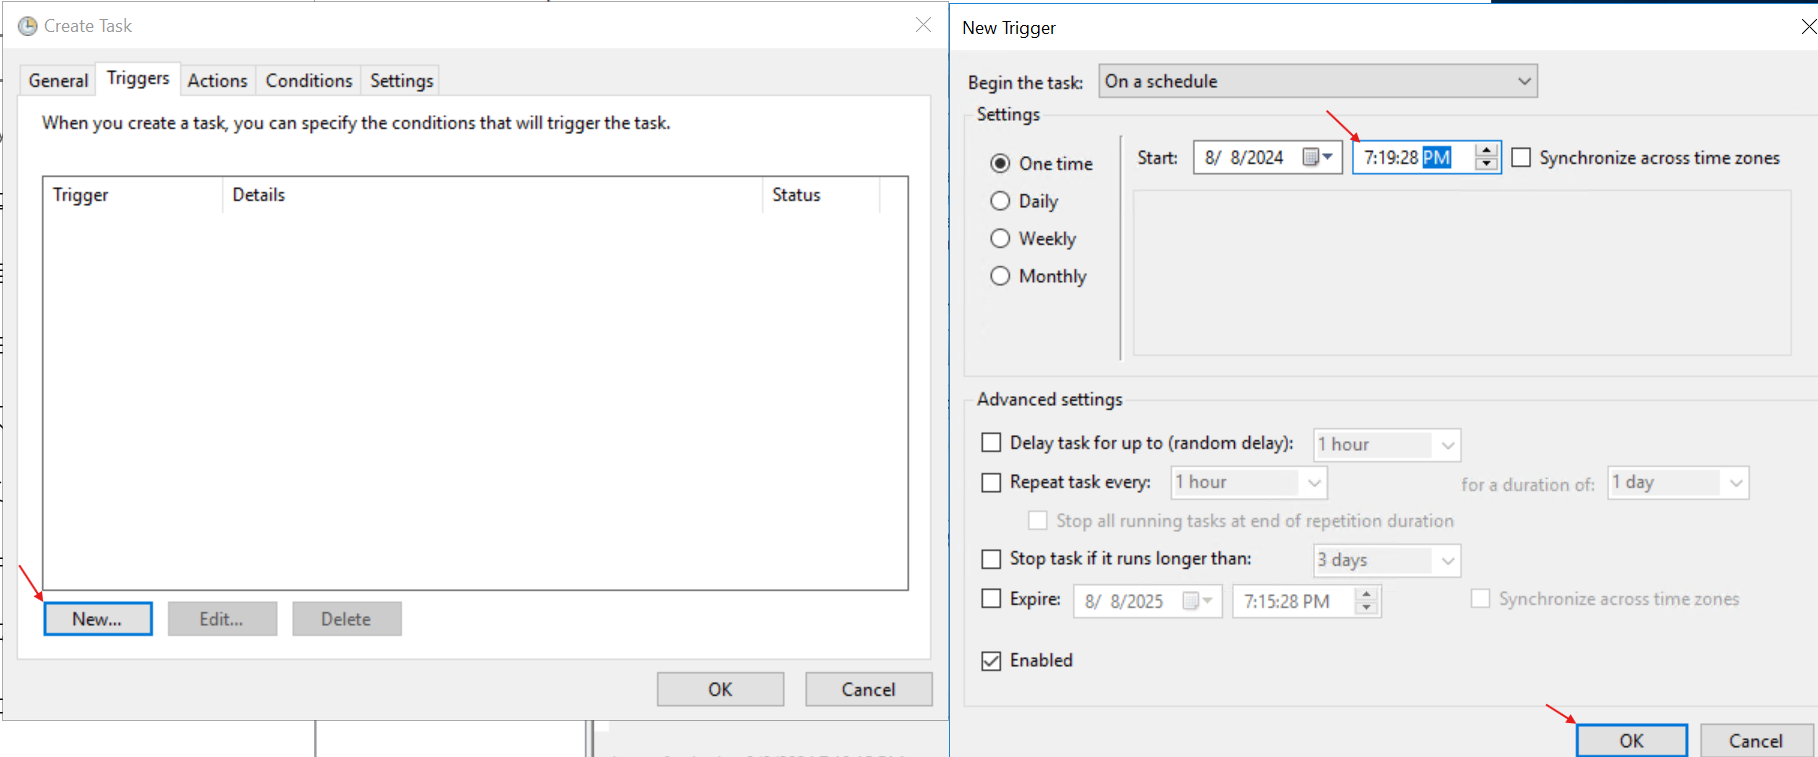
- In the ‘Actions’ tab, create a new action to open Internet Explorer and select ‘OK’ to save when done:
- If we go to the Event Viewer, we can look for the EventID ‘4698’ and can see that it has been logged on the system:
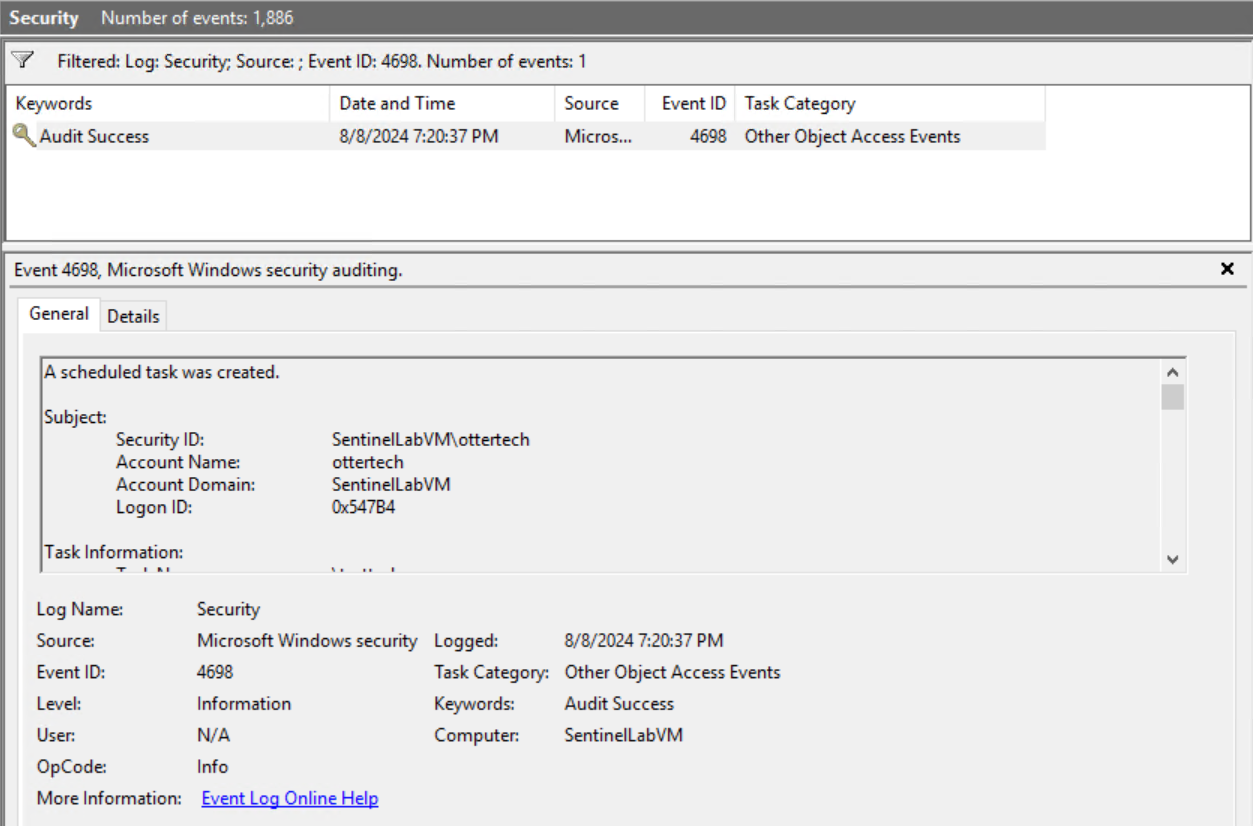
We have now created a scheduled task.
Part 6: Test Kusto Query Language (KQL) Queries for EventID
Part 7: Writing an Analytics Rule for Incident Alerts
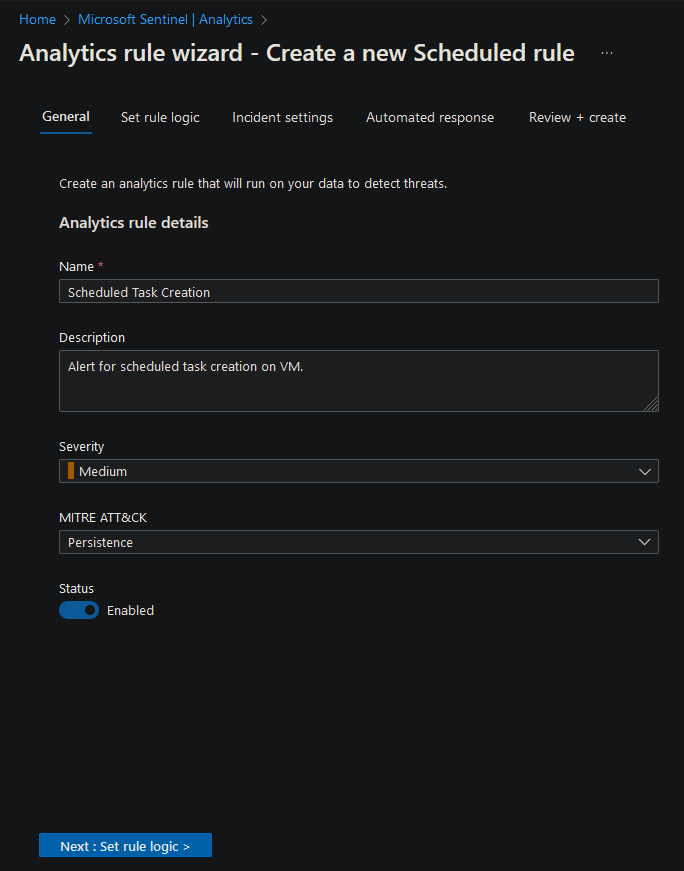
Writing an Analytics Rule will allow us to setup automatic incident alerts in Sentinel. This will streamline incident response and reduce investigation and remediation times.
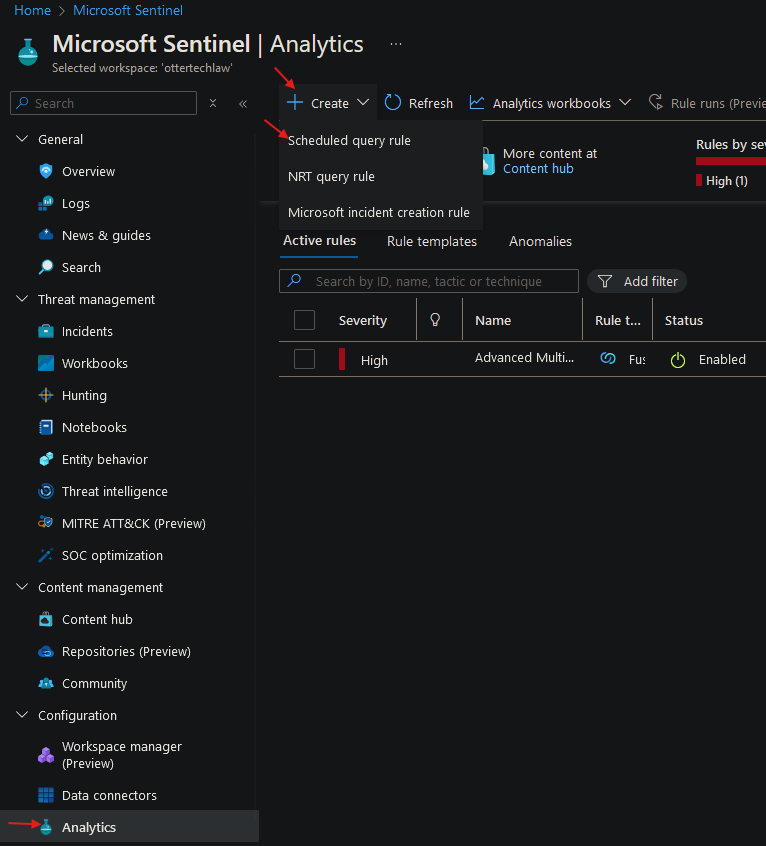
- Navigate to Sentinel portal and in ‘Analytics’, create a ‘Scheduled query rule’:
- Give the Analytics Rule a name and description:
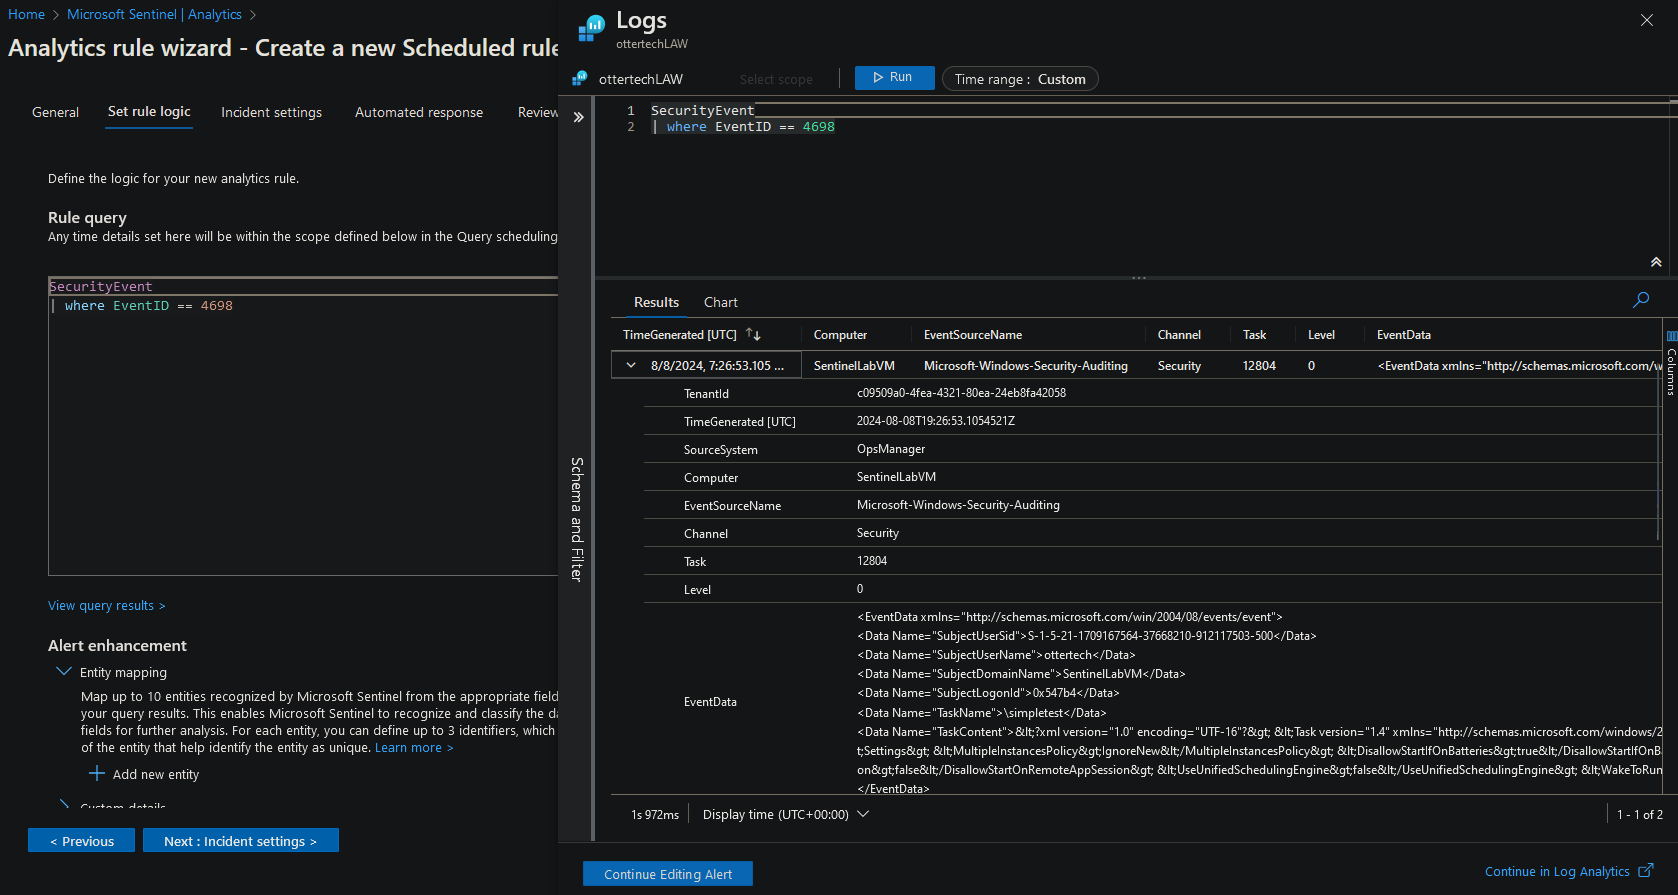
- We can run a simple query to test if we have data connectivity for this EventID. Note the EventData, we will use this in the next step:
Security Event
| where EventID == 4698
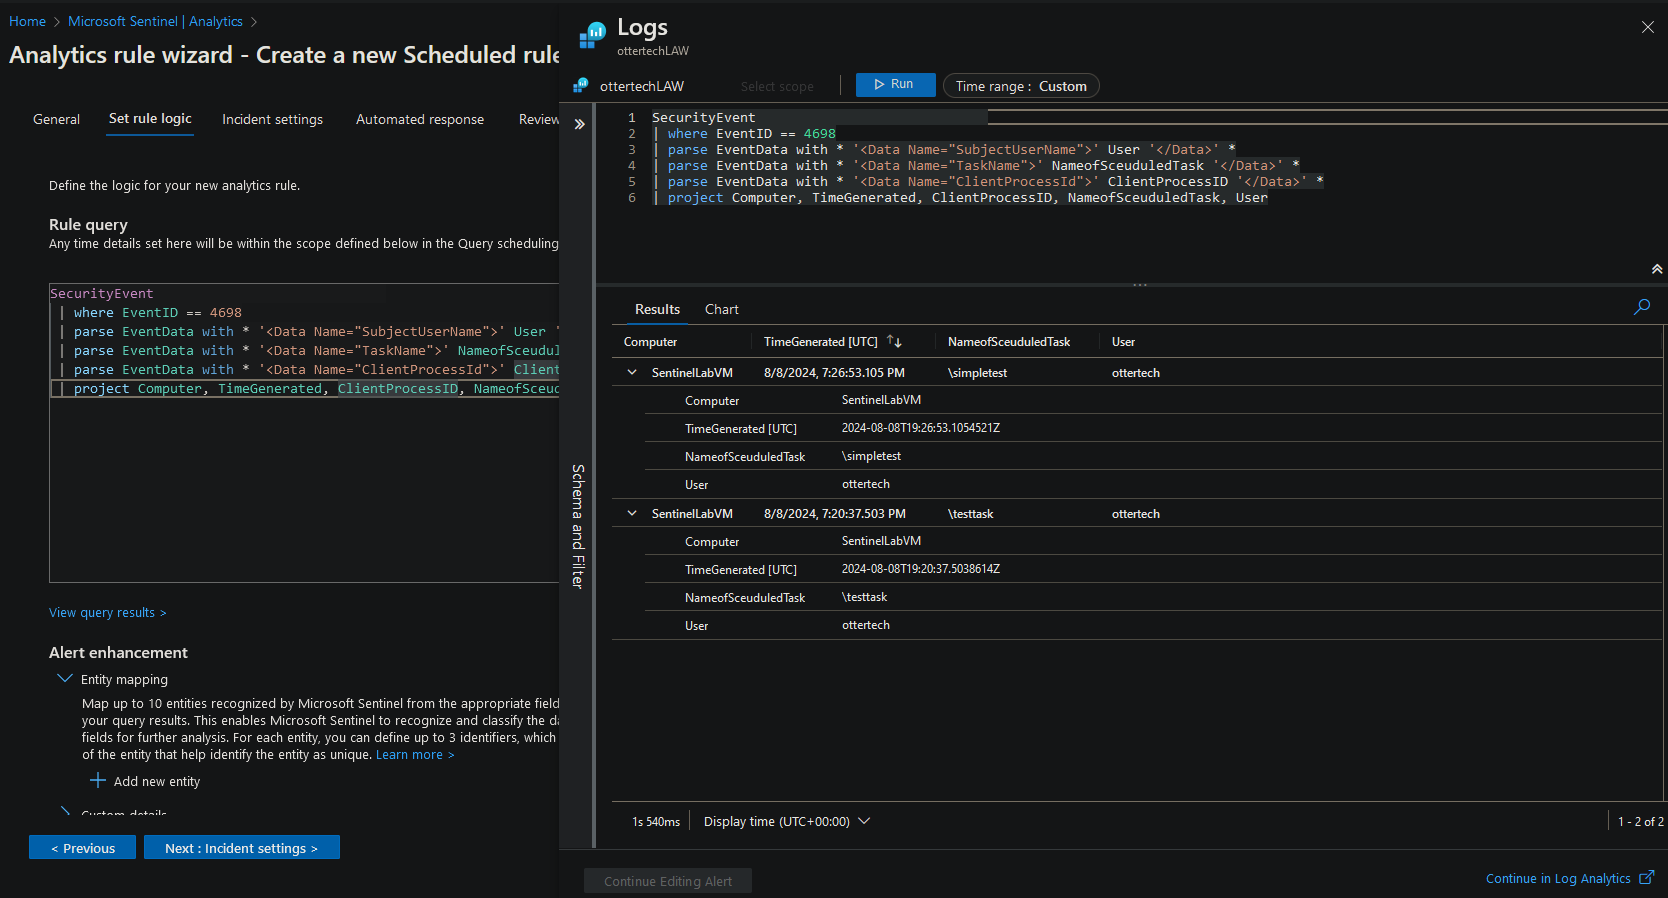
- Using the KQL query from Charles Cyberwox, we are able to have a more simplified view:
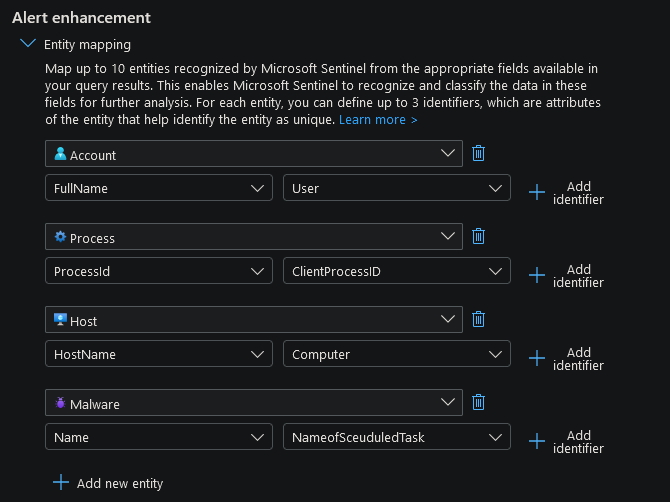
- In the section below, we can enrich alerts by adding more context to the alert:
- For scheduling the queries, we can run it ever 5 minutes:
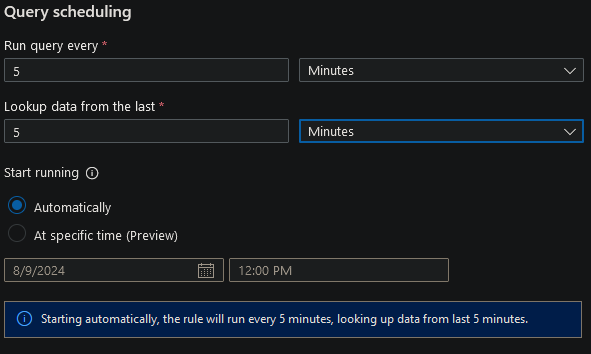
-
Now that the rule has been created, go back into the Honeypot machine and create a few more Scheduled Tasks.
-
After waiting for a bit, we can see that Sentinel has alerted us on an incident:
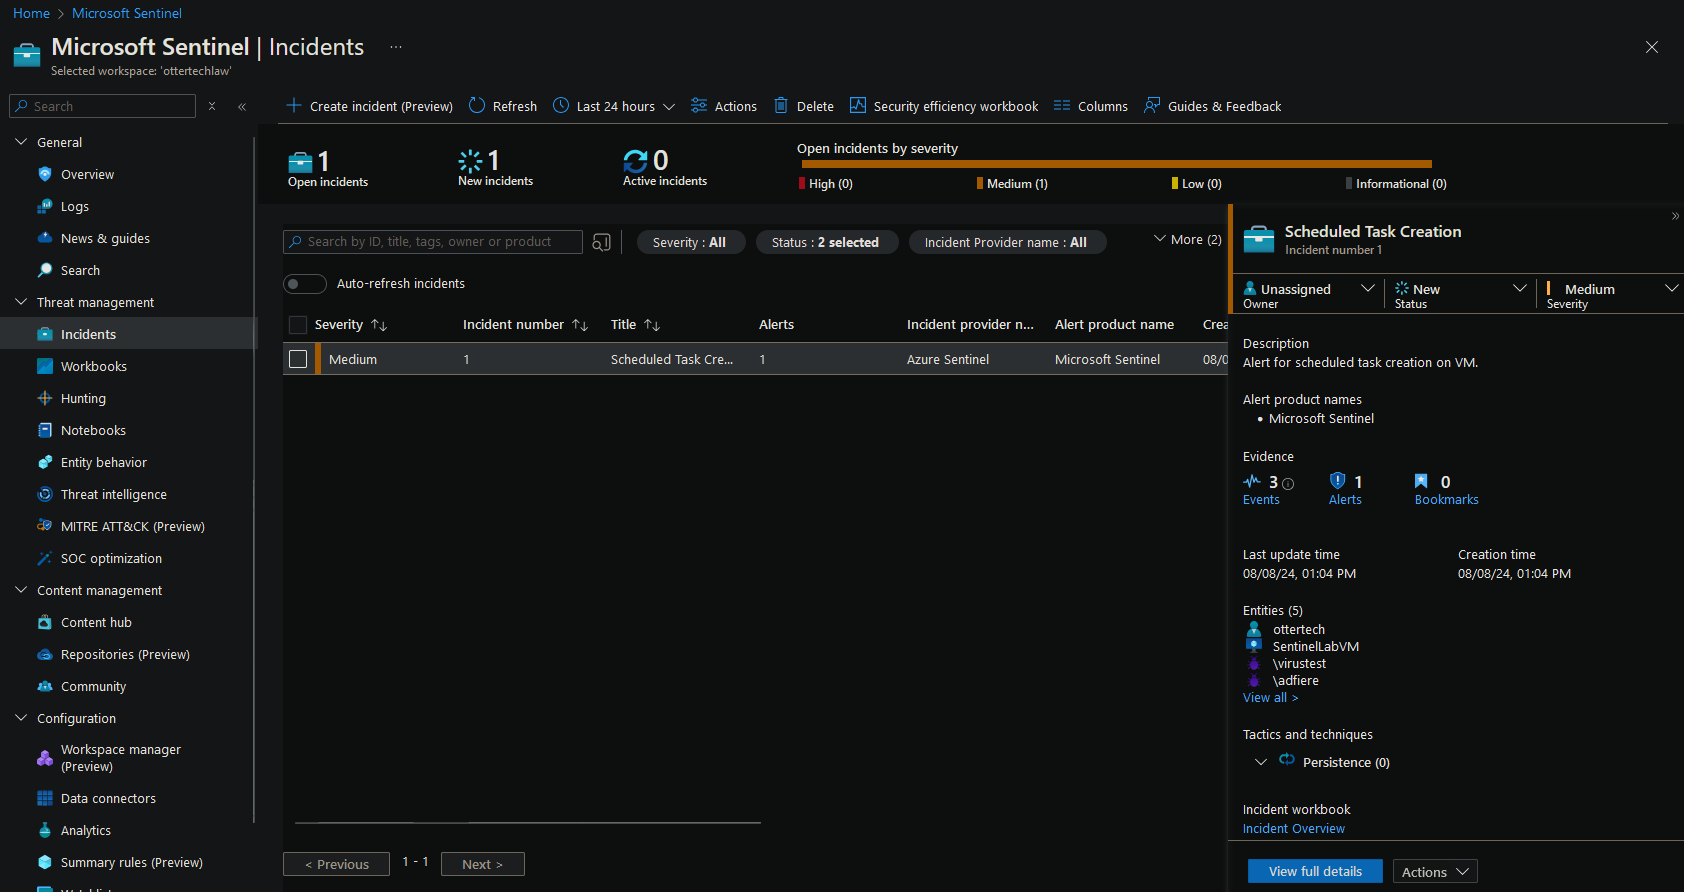
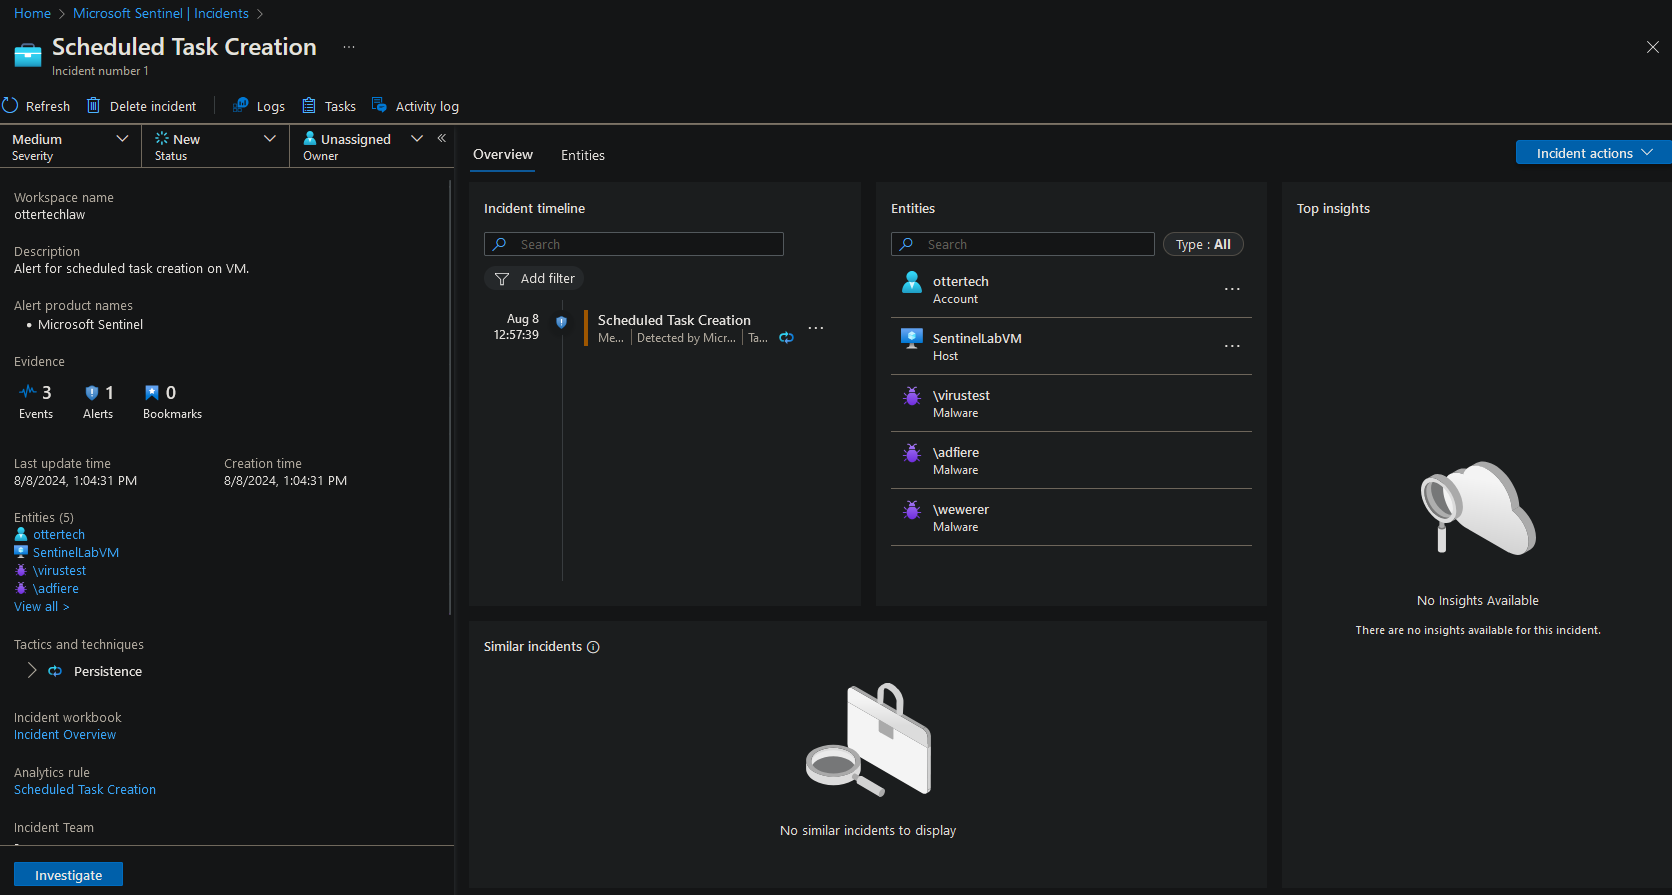
- Upon clicking on the ‘View full details’ button, we can see the Account, Host, and the potential malware that was created on the VM:
In Sentinel, we can now query for failed RDP attempts:
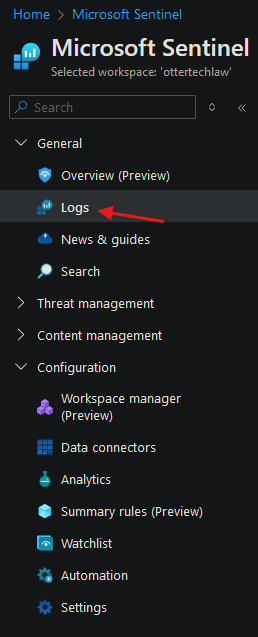
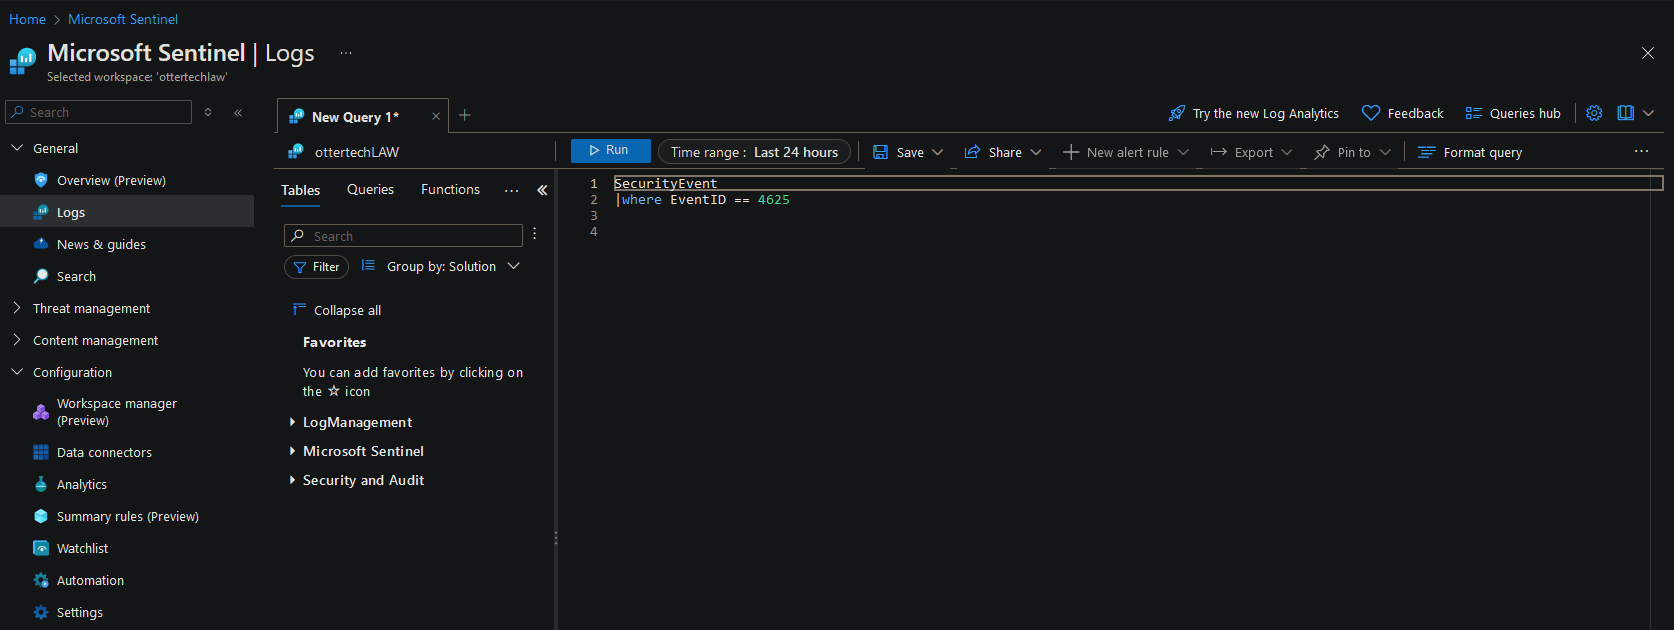
- Go to the “Logs” section in Azure Sentinel:
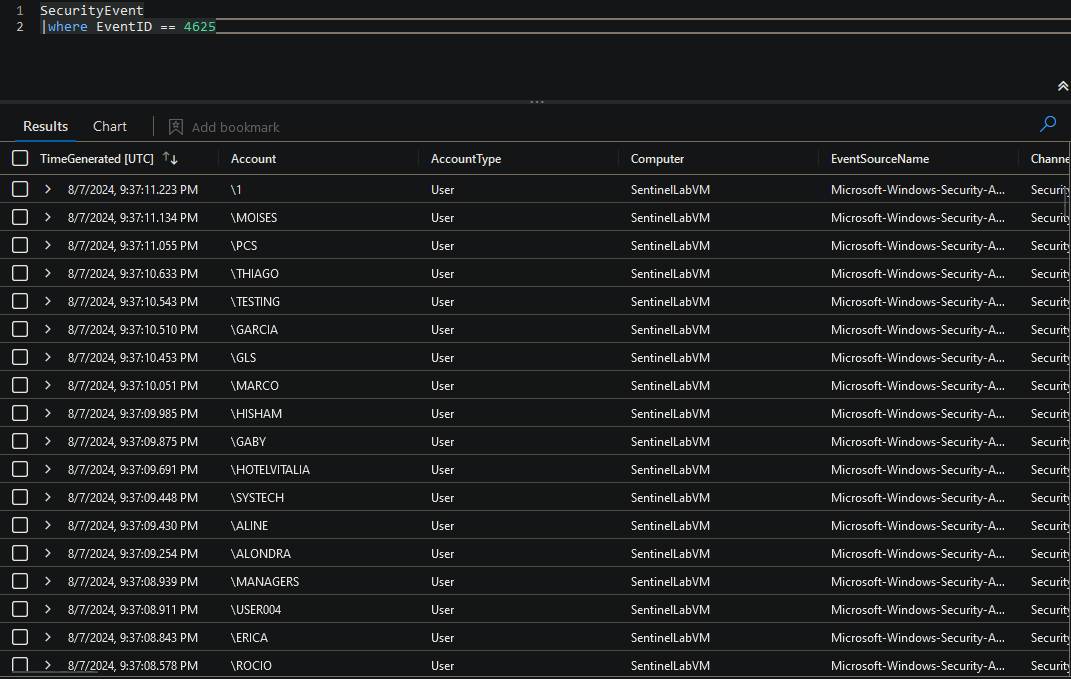
- Use KQL to query for failed RDP attempts (EventID = 4625):
kql SecurityEvent | where EventID == 4625
- This query filters failed logon events where the EventID is equal to ‘4625’.
- We can also specify a more specific query to filter out information we don’t need:
SecurityEvent
|where EventID == 4625
|project TimeGenerated, Account,IpAddress, TargetAccount, TargetUserName 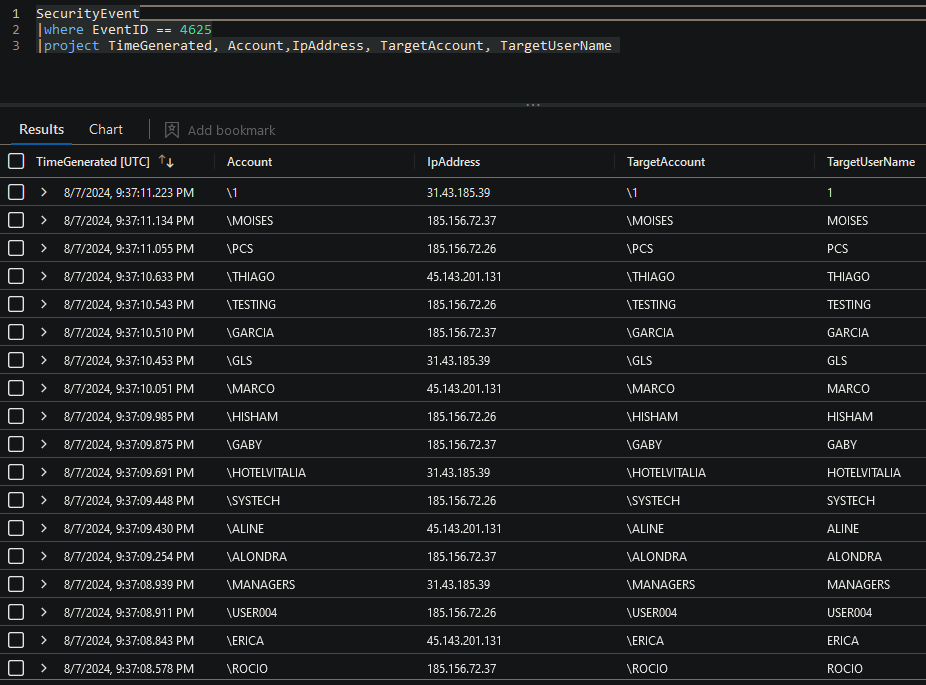
Part 8: Utilizing Powershell and GeoIP API to Transform Data
In order to setup alerts in Sentinel for events in an endpoint device.
Enable logging for the Event
- Remote into the honeypot and search for ‘Local Security Policy’, Select ‘Advanced Audit Policy Configuration’, ‘Object Access’, right click on ‘Audit Other Object Access Events’ and select ‘Properties’:
- Select all the checkboxes on the properties page:
3. Select ‘Apply’ and ‘Ok’.
Creating a Scheduled Task:
- Search ‘Task Scheduler’ in the Honeypot VM.
- Select ‘Action’ and ‘Create Task’:
- Give the Task a name and under the ‘Configure for’ section, select your OS:
- On the ‘Triggers’ tab, select the ‘New…’ button to create a new trigger. On the right, edit the date to be a couple minutes ahead:
- In the ‘Actions’ tab, create a new action to open Internet Explorer and select ‘OK’ to save when done:
- If we go to the Event Viewer, we can look for the EventID ‘4698’ and can see that it has been logged on the system:
We have now created a scheduled task.